Dataflow
What is a Dataflow?
A Dataflow is a way of describing the meaning of data. It is a visual representation of how data flows from one Data Model, typically a Data Asset, to another. This helps users to understand where data has been extracted from, how it has been extracted and the series of transformations it has gone through.
Each Dataflow has a source Data Model, which is where the data originated from, and a target Data Model, which is where the final data will be located. The transformations in between define how the data from one or more Data Elements within the source Data Model flow into one or more Data Elements within the target Data Model.
How are Dataflows used?
The Dataflows relating to each Data Asset can be found in the Dataflows tab at the bottom of the details panel, when the relevant Data Model is selected in the Model Tree.
The Dataflows tab displays a diagram which consists of a series of annotated grey blocks connected by annotated arrows. This tab allows you to view the Dataflows at a Data Model level, a Data Class level and a Data Element level. Therefore, the grey blocks can represent Data Assets, Data Classes or Data Elements, depending on the selected view. The arrows represent the relevant transformations that have occurred and are annotated with human readable descriptions.
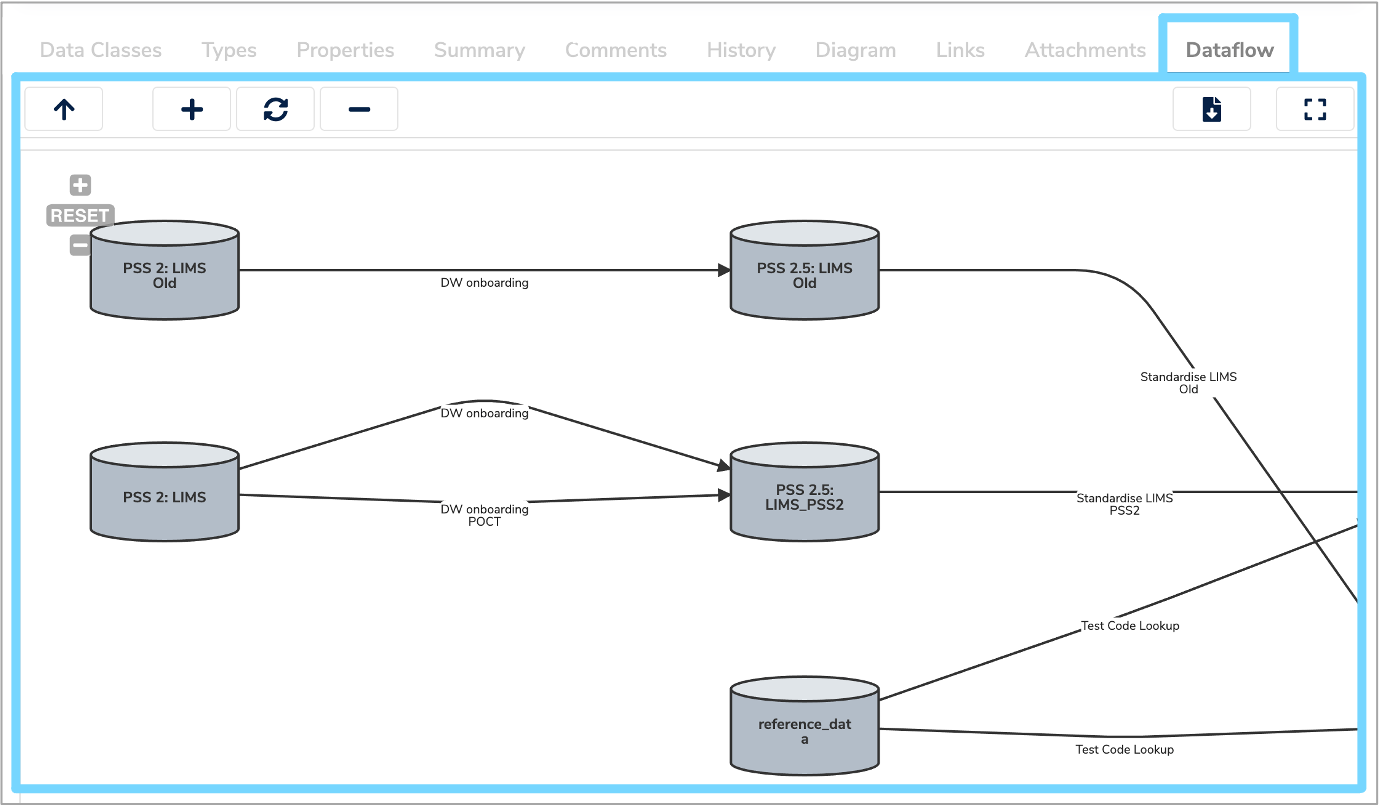
Data Model view
When you first click the Dataflows tab, the Data Model view will initially be displayed. This gives a high level overview of how data flows from one Data Asset to another. The grey blocks represent Data Assets which can be databases, lab systems or modules of data.
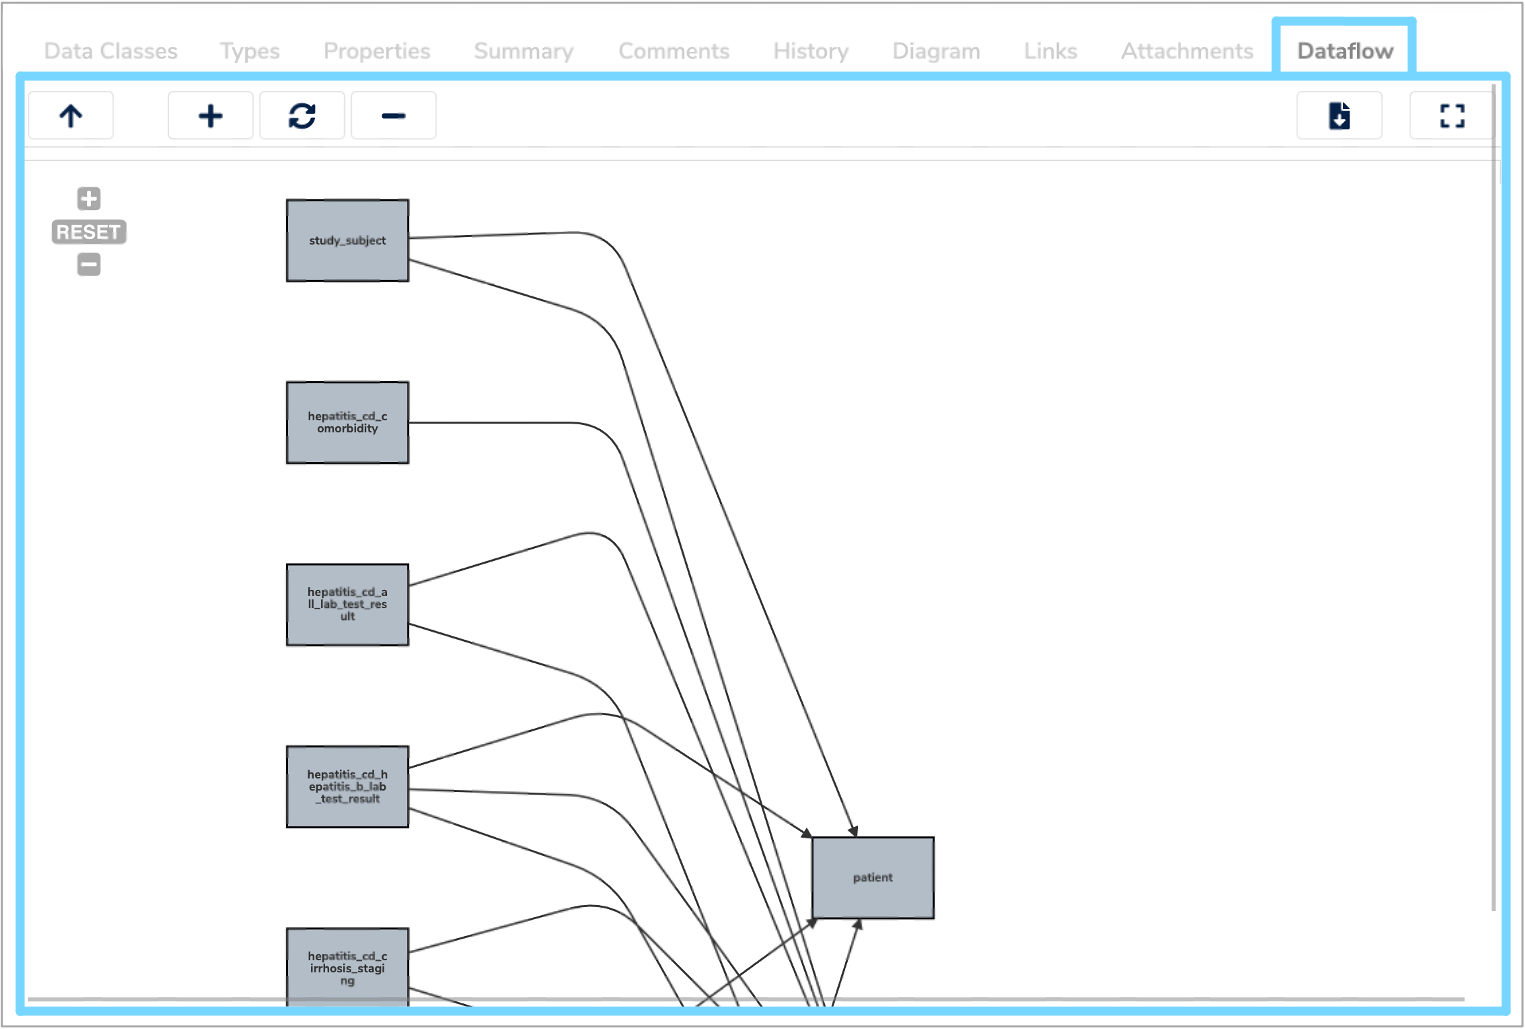
Data Class view
To find out information on the different components of a particular Dataflow and how tables of data flow from one place to another, you can access the Data Class view.
To do this, hover over one of the transformation arrows until the hand icon appears and double click. The Data Class view will then be displayed with each Data Class represented by a grey rectangle.
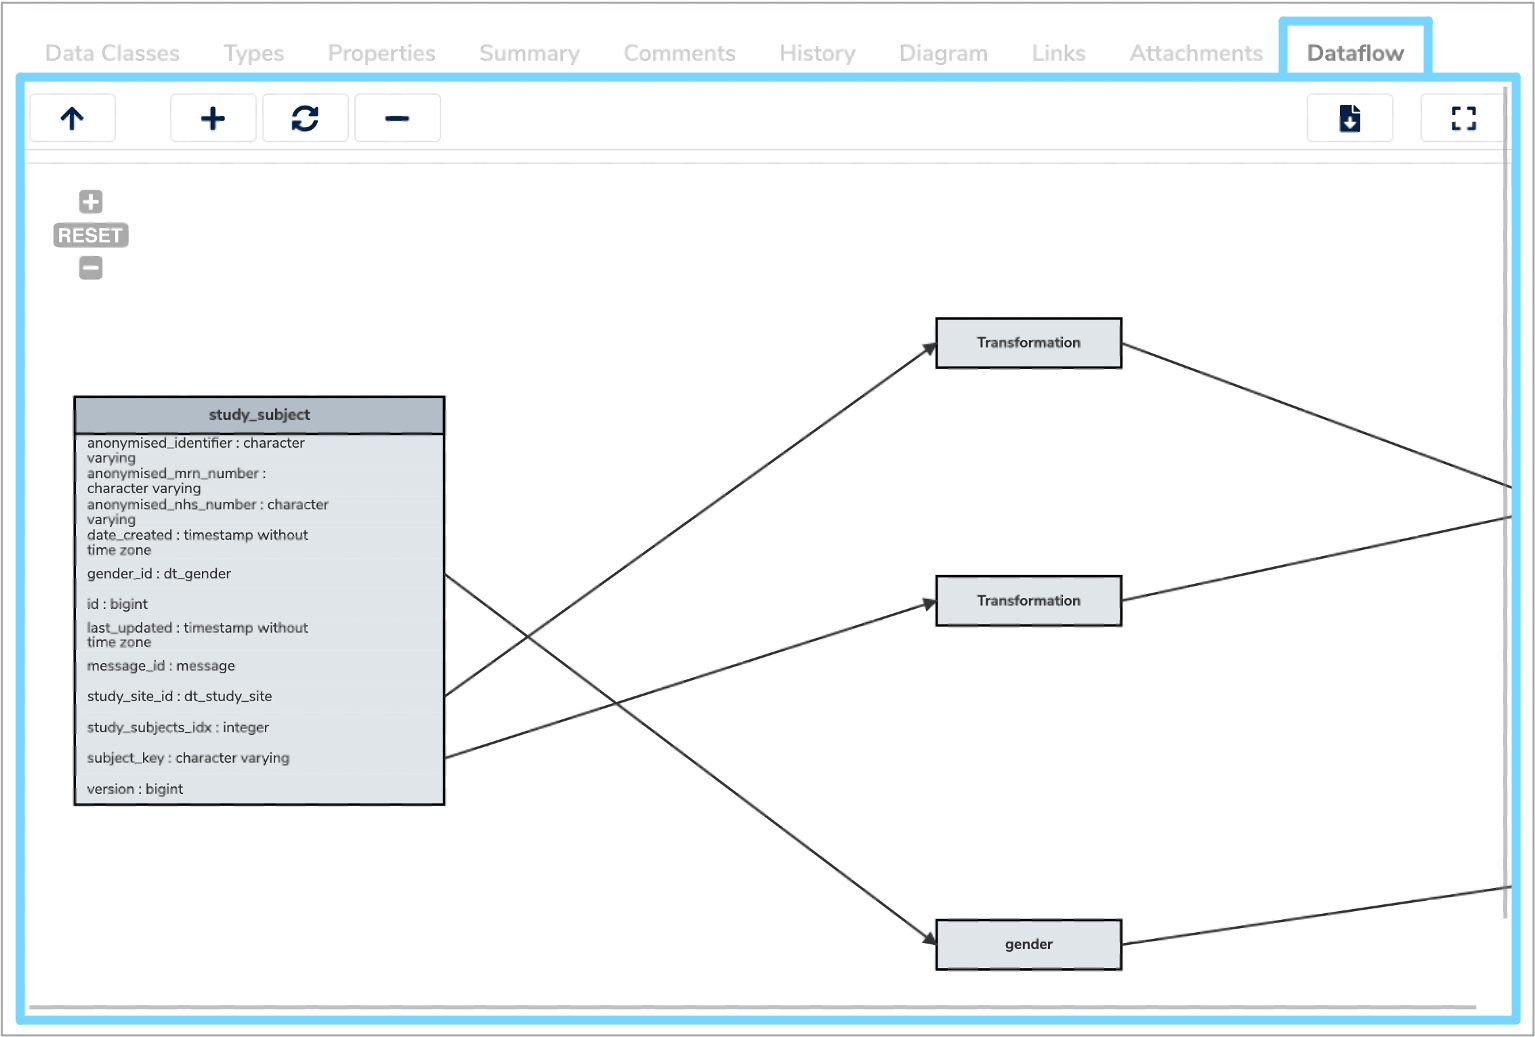
Data Element view
To find out more details on the specific fields of a data product and how they have been derived, you can access the Data Element view.
Again, hover over a transformation arrow until the hand icon appears and double click. Here, you will find the various fields grouped together and the relationships between them. This is particularly useful for end users as it explains how data has been manipulated.
Zoom
In all three views, you can zoom in and out by scrolling on your mouse, or by clicking the ‘+ Zoom in' and ‘- Zoom out' buttons at the top left of the Dataflows view and in the header bar.
Reset
To reset the view, select ‘RESET’ at the top left of the Dataflows view or click the circular arrow ‘Reset zoom and canvas’ button in the header bar.
Fullscreen
You can also view the Dataflow tab in fullscreen mode by clicking the 'Popup in full screen' icon on the top right of the header bar.
Download image
To download an image of the Dataflow select the 'Download as image' icon at the top right of the header bar. This will download a png image of the current view displayed in the Dataflow tab to your downloads folder.
![]()
Navigating through Dataflows
To navigate between the three different views, hover and double click over the transformation arrows in each view to access the next level. For example, to move from the Data Model view to the Data Class view.
To navigate up a level of hierarchy, select the upwards arrow ‘Move up a level of hierarchy’ icon in the top left of the header bar. For example, to move from the Data Class view to the Data Model view.
In all three views you can move the blocks and transformation arrows by clicking and holding the left mouse button which will allow you to drag them to the desired position. This can be helpful to visualise the Dataflows in a clearer manner.